
Lessons learned from the 2024 4th Grade Math STAAR
- Aaron Daffern
- Nov 30, 2024
- 4 min read
The 2024 4th Grade Math STAAR continued statewide online testing and several new item types. Using a modified version of the statewide item analysis report, I examined the readiness standards that had less than 60% mastery. Each standard has both an analysis of the items themselves to infer what made them so difficult and instructional implications for educators to ensure a more successful 2025 STAAR test.
Standard | # of items | % mastery |
4.5D | 2 | 32 |
4.4H | 1 | 35 |
4.3E | 1 | 39 |
4.8C | 2 | 40.5 |
4.7C | 1 | 46 |
4.3D | 2 | 48 |
4.5A | 2 | 50 |
4.5B | 2 | 52 |
4.4A | 1 | 55 |
4.2G | 2 | 58 |
4.6D | 1 | 59 |
Access the slide deck here.
4.5D - 32% overall mastery
solve problems related to perimeter and area of rectangles where dimensions are whole numbers
#9 - 42% correct

#24 - 22% correct

Analysis
Students had to derive dimensions of a square given the perimeter to calculate the area (#9)
Students had to find the area of a composite shape (3.6D)
For #24, most student (36%) chose C [perimeter]
Instructional Implications
Show students how to draw a representation to visualize the problem
Practice composite figures, finding area multiple ways and perimeter
4.4H - 35% overall mastery
solve with fluency one- and two-step problems involving multiplication and division, including interpreting remainders
#4 - 35% correct

Analysis
Students had to divide twice
Almost as many students chose A (29%), dividing once, as those who chose the correct answer
Instructional Implications
Have students draw strip diagrams to represent the relationships
Model for students how to use multiple strip diagrams (or a multi-part strip diagram) to solve two-step problems
Watch the full walkthrough of all 32 items on the 2024 4th Grade STAAR below.
4.3E - 39% overall mastery
represent and solve addition and subtraction of fractions with equal denominators using objects and pictorial models that build to the number line and properties of operations
#14 - 39% correct

Analysis
Both measurement problems involved money
First problem (#3) was fairly straightforward
Second problem (#16) was more challenging, requiring counting bills and coins, calculating change, and entering exact amount
Instructional Implications
Give students problems to solve involving money, including calculating change, and remove all answer choices
Ask variety of questions from collection of coins (e.g., How much more money until she saves $--? If she adds 3 more dimes and 4 more quarters…?)
4.8C - 40.5% overall mastery
solve problems that deal with measurements of length, intervals of time, liquid volumes, mass, and money using addition, subtraction, multiplication, or division as appropriate
#3 - 61% correct

#16 - 20% correct

Analysis
Student had to interpret a picture to name fractions and name them
The fraction button on the equation editor is not intuitive
Instructional Implications
Give students opportunities on Cambium to enter fractions
Show how the picture gives the answer without needing to add fractions
4.7C - 46% overall mastery
determine the approximate measures of angles in degrees to the nearest whole number using a protractor
#13 - 46% correct

Analysis
Correct answer required students to subtract measures
Almost as many students chose C (38%) as D
Instructional Implications
Use actual protractors during instruction and have students draw an angle and calculate it multiple times with different starting values
Use reasonableness and right angles to eliminate answer selections
4.3D - 48% overall mastery
compare two fractions with different numerators and different denominators and represent the comparison using the symbols >, =, or <
#8 - 59% correct

#22 - 37% correct

Analysis
Instructional Implications
Practice comparing fractions with three or four different denominators
Give students opportunities to use reasoning to quickly compare fractions
4.5A - 50% overall mastery
represent multi-step problems involving the four operations with whole numbers using strip diagrams and equations with a letter standing for the unknown quantity
#7 - 44% correct
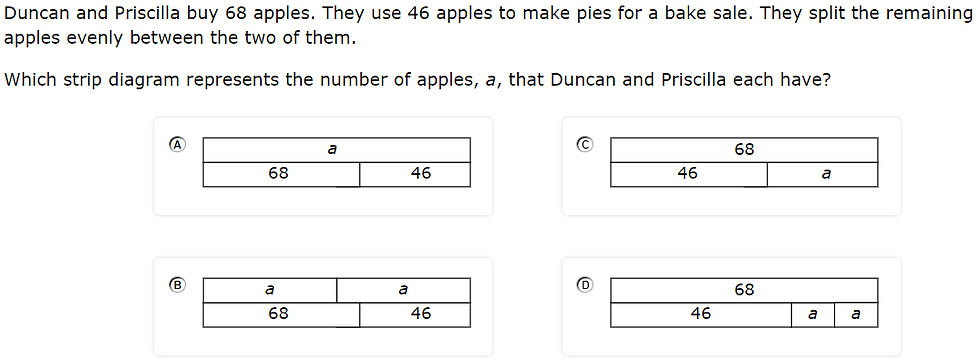
#23 - 37% full credit; 37% partial credit; 26% no credit

Analysis
For #7, students used a strip diagram to represent subtraction and division
Students had to correctly interpret “split evenly” with divide by 2
Instructional Implications
Have students draw strip diagrams to represent problems that ask for equations
Teach students to solve each problem, in addition to representing it, to check their answers
4.5B - 52% overall mastery
represent problems using an input-output table and numerical expressions to generate a number pattern that follows a given rule representing the relationship of the values in the resulting sequence and their position in the sequence
#10 - 47% correct

#32 - 57% correct

Analysis
Both problems involved additive relationships
For #32, 30% of students chose A (+7 to output, not input)
Instructional Implications
Ensure students know that the rule is applied from input to output, regardless of orientation of the table
Give students practice with adding a third column that represents the expression that applies the rule
4.4A - 55% overall mastery
add and subtract whole numbers and decimals to the hundredths place using the standard algorithm
#19 - 55% correct

Analysis
Basic decimal addition and subtraction with regrouping
Students had to interpret “save” and “coupon” as subtraction
Instructional Implications
Students should still draw a strip diagram or picture to represent the problem
Provide multiple terms for real-life situations that denote addition or subtraction
4.2g - 58% overall mastery
relate decimals to fractions that name tenths and hundredths
#5 - 64% correct

#29 - 52% correct

Analysis
Both problems involved improper fractions
Instructional Implications
Show students multiple visualizations of improper fractions and correct naming of decimals
Connect regrouping 10 ones into 1 ten with regrouping 10 tenths into 1 one
4.6D - 59% overall mastery
classify two-dimensional figures based on the presence or absence of parallel or perpendicular lines or the presence or absence of angles of a specified size
#28 - 39% full credit; 40% partial credit; 21% no credit

Analysis
Students most likely easily identified Figure R and struggled with Figure T
Figure T is a heptagon/septagon (7-sided)
Instructional Implications
Provide practice opportunities for identifying perpendicular and parallel lines with irregular shapes
Comentarios